
The Autolab Insights
From raw data to refined intelligence: the Autolab perspective.
July 24, 2026
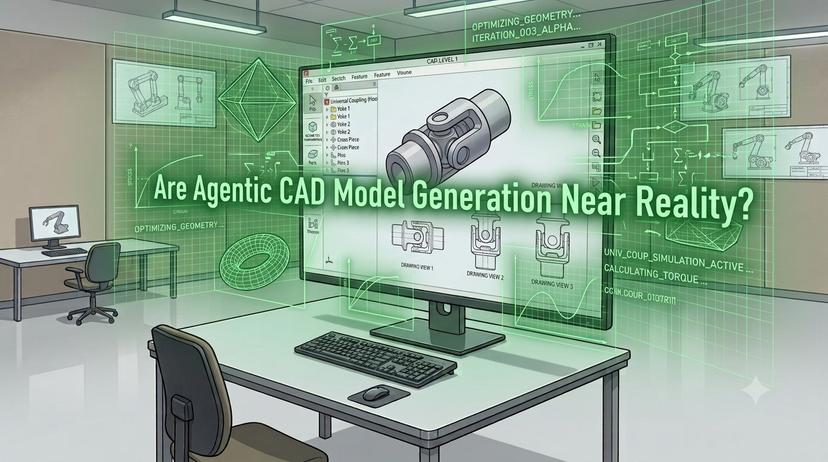
Are Agentic CAD Model Generation Near Reality?
"CAD automation," were usually about scripts that renamed exported files, generated drawings, or automated repetitive clicks inside a CAD package. Today, the same phrase means something entirely different. A user can upload a hand-drawn sketch, a photograph of a bracket, a dimensioned engineering drawing, or simply type: "40 mm steel bracket with two M6 mounting holes." Within seconds, our system generates executable CAD code, validates it, executes it, and returns a manufacturable STEP model. This article explains what we built, where the real difficulties were, and why AI-generated CAD is becoming one of the most interesting areas in engineering software. CAD is becoming programmable For decades, CAD software has been designed around direct human interaction. Engineers sketch profiles. They constrain geometry. They extrude, fillet, chamfer, pattern, and assemble parts manually. Even though modern CAD packages have extensive APIs, most design work is still driven by mouse clicks. Artificial intelligence is changing that workflow. Instead of manually constructing geometry feature by feature, engineers can increasingly describe what they want in natural language or provide an image as input. Large language models now understand engineering intent well enough to generate parametric CAD code, while vision-language models can interpret technical drawings and infer geometric relationships directly from images. Major CAD vendors are already incorporating generative design, AI-assisted feature creation, and automated documentation into production workflows. What was experimental research only a few years ago is rapidly becoming part of everyday engineering. Rather than waiting for those capabilities to mature elsewhere, with our specialty in CAD automation invested in building our own system from the inference pipeline to the CAD execution engine. AI-generated parametric CAD model produced directly from a natural-language prompt. The surprising part wasn't generating CAD Before starting this project, we assumed the biggest challenge would be convincing an AI model to generate valid geometry. It turned out that wasn't the bottleneck. We experimented with multiple CAD backends, including: CadQuery Build123d PythonOCC OpenSCAD Onshape APIs SolidWorks automation Each has different strengths. CadQuery and Build123d offer expressive Python-based parametric modeling. OpenSCAD provides deterministic constructive solid geometry. Onshape exposes a cloud- native CAD API. SolidWorks remains deeply integrated into manufacturing workflows. Once the translation layer for each backend was built, producing a valid STEP file became relatively reliable. The difficult problem was deciding which system should solve which request. Compute is an engineering problem too One lesson became obvious very quickly. Not every CAD request deserves the same amount of compute. Generating a simple L-bracket with two holes is fundamentally different from reconstructing a complex mechanical assembly containing dozens of interacting features. Running a frontier language model for every request produces good results but it is slow and unnecessarily expensive. Running everything through a lightweight model is fast but complex geometry begins to fail in subtle ways. Reliability matters more than impressive demos Generating CAD code is only the first step. Trusting it is the real challenge. Current text-to-CAD systems are remarkably good at producing visually convincing models. They are much less reliable when manufacturing constraints enter the picture. Questions such as: Are dimensions actually respected? Are hole locations correct? Does the part remain fully parametric? Are wall thicknesses manufacturable? Will downstream CAD software import the STEP correctly? remain active research problems across the industry. A model that "looks right" is not necessarily manufacturable. Manufacturability checks catch issues that are invisible in a purely visual review. To reduce hallucinations, we built our generation pipeline around retrieval-augmented generation (RAG), grounding model outputs in verified examples rather than relying entirely on model memory. Instead of asking the language model to invent geometry from scratch every time, it retrieves structurally similar examples, references known- good implementations, and generates code from a much more reliable foundation. That single architectural decision dramatically improved consistency. Vision became just as important as language Many real engineering workflows don't begin with text. They begin with photographs. Or scanned engineering drawings. Or sketches on paper. To support those workflows, we trained our own vision-language models capable of translating dimensioned engineering drawings directly into executable CAD code. Owning the training pipeline mattered. Rather than depending entirely on third-party APIs, we fine-tuned our models on our own infrastructure, allowing us to continuously improve performance as new datasets become available. That also gives us flexibility to experiment with architecture, retrieval systems, prompting strategies, and evaluation methods without waiting for external model providers. Vision-language models translating hand sketches and dimensioned drawings into executable CAD code. What happens inside the CAD agent At a high level, the pipeline looks like this: Accept text, images, sketches, or engineering drawings. Estimate geometric complexity. Retrieve similar verified CAD examples using RAG. Generate parametric CAD code. Execute the code inside the appropriate CAD backend. Validate geometry. Export manufacturable STEP files. Every stage includes checks designed to reduce hallucinations before the final model reaches the user. The objective isn't simply producing geometry. It's producing geometry that engineers can trust. Why we're building this The goal isn't replacing CAD engineers. It is reducing the distance between an idea and something that can actually be manufactured. For experienced engineers, that means eliminating repetitive modeling work so they can focus on engineering decisions instead of feature creation. For students, makers, and first-time users, it means removing years of software learning before they can turn an idea into a physical object. Someone should be able to sketch a phone stand on paper, upload it, and receive a fully editable CAD model. Someone else should be able to upload a production engineering drawing and receive a manufacturable STEP file ready for downstream workflows. Those are very different users. Our aim is to build one system capable of serving both. Where AI CAD is heading We're still at the beginning. Today's systems are becoming good at generating parts. Tomorrow's systems will understand assemblies, tolerances, manufacturing processes, simulation constraints, cost optimization, and design intent—not just geometry. The CAD software of the future won't simply draw what engineers ask for. It will collaborate with them. We're excited to help build that future. Er. Pravakar Bogati, Autolab Technologies Pvt.Ltd., April 2026 Kupondol-10, Lalitpur, Nepal, info@autolabtechnologies.coms
July 20, 2026
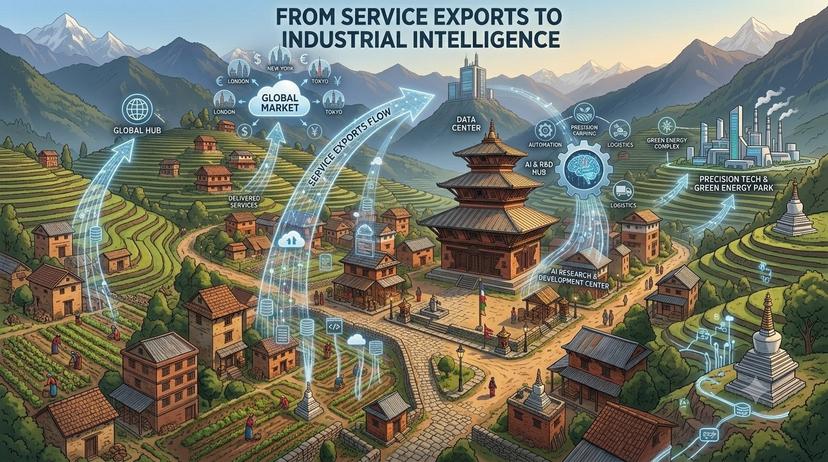
From Service Exports to Industrial Intelligence:
Abstract. Within roughly a decade, Nepal’s information technology (IT) service exports grew from a minor activity to an estimated one billion United States dollars per year, overtaking tourism as the country’s leading service export. Prevailing accounts attribute this expansion primarily to low labor costs. This paper argues that such an explanation is incomplete and potentially misleading for policy: the more durable comparative advantage lies in the depth and demonstrated quality of the country’s engineering talent. Drawing on triangulated secondary data industry-association estimates, central-bank balance-of- payments statistics, World Bank and World Trade Organization measures, market-research reports, and firm-level disclosures we characterize the scale, composition and capability of the Nepalese IT workforce, and interpret the large discrepancy between official and industry export figures as an indirect signal of distributed, client-validated quality. We then examine the global digital transformation of manufacturing, a market on the order of several hundred billion dollars in which value is migrating from hardware toward software and artificial intelligence (AI). Mapping demonstrated Nepali competencies computer vision and data annotation, large-scale data analytics, enterprise AI, and high-throughput transactional systems onto the requirements of smart manufacturing, we contend that the workforce is well positioned to enter this domain. We discuss risk factors (talent emigration, measurement opacity, policy and tax uncertainty, financial-system informality, and geographic concentration), state the limitations of the available evidence, and outline a research and policy agenda. Keywords: IT service exports, Nepal, Digital transformation, Smart manufacturing, Industry 4.0 · Offshore software engineering, Talent economics, Technology policy. 1 Introduction The international image of Nepal is dominated by tourism, agriculture, and the export of manual labor. This image is increasingly out of date. Over the past decade the country has developed a substantial software and IT-enabled services export sector; by 2025, industry bodies estimated its annual value at approximately one billion United States dollars (USD), having more than doubled in three years, with the sector overtaking tourism as the leading source of service-export earnings [1, 2, 4]. The dominant explanation for this growth emphasizes cost: Nepali engineers are inexpensive relative to comparable talent in India or in high-income economies, and work is said to have followed the price differential. We do not dispute that cost lowers the barrier to a first engagement. We argue, however, that cost is an insufficient explanation for the persistence and complexity of the work now performed in Nepal, and that treating cost as the principal selling proposition is a strategic error. A price-based position is structurally fragile: the lowest-cost provider is, by definition, always replaceable by a cheaper one, and generative AI is rapidly commoditizing routine software tasks. A capability-based position is more defensible. This paper makes three contributions. First, it consolidates fragmented public evidence on the scale and composition of Nepal’s IT workforce and interprets the well-documented gap between official and industry export figures as an indirect indicator of distributed, client-validated quality (Section 4). Second, it characterizes the global digital transformation of manufacturing as a large, software-intensive market whose value is migrating into precisely the competencies the Nepali sector has demonstrated (Section 5). Third, it advances and qualifies a capability–demand alignment argument, mapping observed competencies onto manufacturing-DX(Digital Transformation) applications, and identifies the conditions and risks that bear on whether the opportunity can be realized (Sections 6 and 7). The paper is positional and analytical rather than empirical; Section 3 states the data and method, and Section 7.3 the resulting limitations. 2 Background and related work 2.1 Nepal’s IT services sector The most frequently cited baseline is a 2022 study by the Institute for Integrated Development Studies (IIDS), which valued Nepal’s IT service exports at about USD 515 million, an increase of roughly 64% over the prior year, and identified IT as having overtaken tourism among service exports [4, 5]. Subsequent industry estimates from the Nepal Association for Software and IT Services (NAS-IT) place the 2025 figure near USD 1 billion [1, 2]. Reported workforce estimates rose from more than 70,000 professionals in 2022 to approximately 100,000 in 2025, with employment concentrated (around 90%) in the Kathmandu valley [1]. The Government of Nepal has designated a ten-year “IT Decade” and, in the fiscal-year 2025/26 budget, granted the sector “special industry” status with substantial tax relief on export income [6]. 2.2 The digital transformation of manufacturing The instrumentation, simulation and AI-assisted operation of production systems variously termed Industry 4.0, smart manufacturing, or the digital transformation (DX) of manufacturing constitutes one of the larger industrial software markets. Market-research estimates vary by scope, but place factory automation in the several-hundred-billion-USD range and the broader manufacturing-DX layer on a trajectory toward roughly USD 800 billion or more by 2030 [12, 13]. A recurring observation across these sources is that the fastest-growing and highest-margin components are software and services rather than hardware [14]. The World Economic Forum has estimated that Industry 4.0 could add trillions of USD in manufacturing value [15]; such figures should be read as indicative rather than precise. 2.3 Location economics: cost versus capability The economic-geography literature on offshoring distinguishes between cost-driven and capability- driven location decisions. Cost arbitrage tends to attract commodifiable, well-specified tasks that are easily relocated; capability-driven sourcing attracts complex, trust-dependent work that is comparatively “sticky.” The distinction matters for policy because the two trajectories imply different upgrading paths and different exposure to commoditization. The present paper applies this lens to Nepal, asking which trajectory the available evidence supports. 3 Data and method This is an analytical, position-oriented study based on secondary sources rather than primary data collection. Five source types are used: (i) industry-association estimates (NAS-IT) reported through national media; (ii) official balance-of-payments statistics from Nepal Rastra Bank (NRB); (iii) international statistical measures from the World Bank and the World Trade Organization (WTO); (iv) commercial market-research reports for the manufacturing-DX and factory-automation markets; and (v) firm-level information from company and sector reporting. Because these sources differ in definition, coverage and year, we triangulate rather than aggregate: where estimates diverge, we report the range and treat the divergence itself as analytically informative (Section 4.2). All monetary figures are nominal USD unless stated otherwise. The method’s limitations reliance on estimates, potential selection bias in firm exemplars, and the absence of primary capability measurement are discussed in Section 7.3. 4 The Nepali IT talent pool 4.1 Growth and scale Figure 1 summarizes the two headline trends. Panel (a) shows the estimated trajectory of IT service exports, from roughly USD 314 million in 2021 (derived from the IIDS 2022 figure and its reported year-on-year growth) to about USD 515 million in 2022 and an estimated USD 1 billion in 2025. Panel (b) shows reported employment growth and the sector’s stated decade target of approximately 500,000 jobs, predicated on sustained annual growth near 18% [1, 2]. We emphasize that the 2025 values are industry estimates rather than audited national accounts. Fig. 1. Estimated growth of Nepal’s IT services sector. Asterisks denote industry estimates (2025) and the stated decade target (2035). Sources: IIDS (2022); NAS-IT, via [1, 2, 4]. 4.2 Measurement opacity as a quality signal A notable feature of the sector is that official statistics capture only a fraction of estimated activity. NRB balance-of-payments data record computer and information services of under USD 90 million in one recent half-year (on the order of USD 175 million annualized), whereas industry estimates for the same period approach USD 1 billion, a discrepancy exceeding an order of magnitude [3]. International measures fall between these poles: the World Bank’s narrower ICT-services figure was about USD 118 million (2022) and the WTO’s broader “digitally Fig. 2. Divergent measurements of Nepal’s IT/digital service exports (USD millions). Definitions and reference years differ; the figure illustrates the spread rather than a like-for-like comparison. Sources: NRB; World Bank; WTO; NAS- IT, via [3]. The conventional interpretation of this gap is a measurement and tax-administration problem, since much revenue reaches freelancers and small studios through payment platforms and overseas intermediaries that bypass the domestic banking system [3]. We add a complementary interpretation. A large share of the uncaptured revenue corresponds to engineers selected individually by overseas clients in competitive markets. Unlike an aggregate that can be inflated, or a contract that may reflect non- market factors, tens of thousands of independent client decisions constitute a distributed, repeated market test of quality. The opacity that frustrates the statistician is, read differently, evidence that the demand is capability-driven. 4.3 Firm-level evidence of high-complexity capability Firm-level evidence is consistent with capability-driven demand. We summaries three representative providers; these are illustrative, not a random sample (see Section 7.3). – Enterprise AI. Fusemachines, founded in 2013 by a Nepali computer scientist and reported to be the first Nepali-founded firm to list on the NASDAQ exchange (late 2024), operates a Kathmandu hub of more than 200 engineers, including doctoral-level staff, building enterprise AI for clients in retail, healthcare and finance; its AI Fellowship has trained machine-learning talent since 2017 [8, 10]. – Human-in-the-loop AI and computer vision. CloudFactory’s Nepal operation performs data- pipeline construction, model evaluation and annotation for computer vision in autonomous-vehicle and medical-imaging applications, increasingly including large-language-model fine-tuning, using a production toolchain (e.g., Python, Kubernetes) at a scale comparable to major regional hubs [9]. – Large-scale data analytics. Cotiviti’s Kathmandu center (established 2004) employs on the order of 600 engineers and data scientists building analytics that detect fraud, waste and abuse in the United States healthcare system, used by more than 180 payers including federal agencies [8]. Additional providers include F1Soft Group, whose eSewa and Fonepay platform reportedly processes payments on the order of USD 25 billion annually, alongside analytics and cybersecurity firms [8]. Reported compensation for senior AI roles, and direct freelance billing of several thousand USD per month, are further indirect indicators that the work is not confined to low-complexity tasks [9]. 4.4 The education pipeline The workforce is replenished by a sizeable tertiary pipeline. Tribhuvan University’s Bachelor of Science in Computer Science and Information Technology programme alone enrolls over 3,000 students per year across some 60 affiliated colleges, complemented by computer-engineering programmes at the Institute of Engineering and other universities [11]. The pipeline is therefore broad; its principal weaknesses, discussed below, are curricular currency and the retention of graduates. 5 The manufacturing digital-transformation opportunity The destination market we propose is the digital transformation of manufacturing. Production is shifting from electromechanical systems toward cyber-physical systems in which sensing, simulation, analytics and AI determine machine behavior. As noted in Section 2.2, the software and services layer is both the larger and the faster-growing portion of this market, and the highest-margin one (Fig. 3). Two implications follow for a landlocked, hardware-light economy. First, the value is concentrating in exactly the software and AI competencies the Nepali sector has demonstrated. Second, software and engineering services are delivered over telecommunications infrastructure rather than physical logistics, so the geographic constraints that disadvantage Nepali goods exports do not bind on this category. Fig. 3. Global market size (USD billions), 2025 and 2030, for factory automation and the broader digital transformation of manufacturing. Estimates differ by scope and provider. Sources: MarketsandMarkets [12]; Mordor Intelligence [13]. 6 Capability demand alignment The central claim of the paper is that the competencies demonstrated by Nepali firms (Section 4.3) correspond closely to the requirements of manufacturing DX. Table 1 states the correspondence. The mapping is intended as an analytical hypothesis rather than a demonstrated transfer; its validation is proposed as future work (Section 7.3). Table 1. Hypothesized alignment between demonstrated Nepali IT competencies and manufacturing digital-transformation applications. table.png 71.33 KB A qualification is essential. The same AI tools that are transforming design and manufacturing also lower the barrier to entry across the board. This has two effects of opposite sign. It plausibly shortens the time a capable team needs to enter the domain, since AI-assisted tooling reduces the years previously required to master, for example, computer-aided design. It also intensifies commoditization, reinforcing the argument of Section 1 that a price-based position is unsustainable. The defensible position is domain judgement understanding why an engineered artefact behaves as it does rather than the mechanical production of artefacts. 7 Discussion 7.1 Strategic implications The analysis implies a reorientation of how the sector is positioned, from “low-cost delivery” to “high- capability engineering,” and a targeted move up the value chain into manufacturing DX rather than diffuse expansion of generic outsourcing. For firms, this favors investment in domain specialization and in training pipelines of the kind exemplified by the AI-fellowship model. For policy, it favors measures that retain talent and that reduce the financial and regulatory frictions identified below. 7.2 Risk factors Several factors could prevent realization of the opportunity. Talent emigration: a large fraction of computing graduates is reported to leave the country, so the binding constraint is retention rather than supply. Curricular lag: industry sources report that curricula trail a rapidly changing field, shifting re- training costs onto employers. Policy and trust shocks: tax disputes involving foreign-invested firms have reportedly discouraged investment and illustrate the chilling effect of regulatory uncertainty [6]. Financial-system informality: reliance on payment platforms and informal channels constrains capital formation, contracting and scale [3]. Geographic concentration: the heavy concentration of activity in Kathmandu raises infrastructure and resilience concerns [1]. Countervailing factors include a deepening talent pipeline, English-language proficiency and time-zone complementarity with European, Japanese and Australian clients, recent supportive policy, and a growing hydropower surplus advantageous for compute-intensive AI workloads. 7.3 Threats to validity and limitations The study has clear limitations. First, the core figures are industry estimates and secondary statistics that diverge substantially (Section 4.2); they are not audited and should be treated as indicative. Second, the firm-level evidence is purposively selected to illustrate high-complexity capability and is therefore subject to selection bias; it does not establish the modal capability of the sector. Third, the capability– demand alignment of Table 1 is a hypothesis: this paper does not measure actual skill transfer into manufacturing-DX settings. Fourth, market-research figures for the destination market are vendor estimates that vary by methodology and scope. These limitations motivate the agenda below. 8 Conclusion and future work Nepal’s emergence as a billion-dollar IT-service exporter is better explained by the quality and depth of its engineering talent than by labor cost alone, and the distributed, client-validated nature of much of this demand is evidence of a capability-driven rather than cost-driven trajectory. The competencies the sector has demonstrated computer vision, large-scale analytics, enterprise AI and high-throughput systems align closely with the requirements of the digital transformation of manufacturing, a large and software-intensive market whose value is migrating toward exactly these skills and whose delivery is not constrained by Nepal’s geography. Realizing the opportunity depends on retaining talent, modernizing curricula, and reducing financial and regulatory frictions. Future work should (i) conduct primary survey research to measure the sector’s modal competencies, firm sizes and revenue composition; (ii) develop a longitudinal, methodologically consistent measure of digital-service exports to resolve the measurement gap; and (iii) empirically test the capability– demand alignment through pilot engagements in manufacturing-DX tasks, measuring quality, lead time and client retention against incumbent providers. Declarations All data are drawn from publicly available secondary sources cited in the references; no new datasets were generated. References Kathmandu Post: Nepal’s IT exports near $1 billion. Can the momentum be sustained? (25 February 2026) Fiscal Nepal: Nepal’s IT service exports reach estimated Rs145 billion annually (NAS-IT / G. R. Pandey). (12 February 2026) Katmandu Journal: How big is Nepal’s IT sector, really? (NRB, World Bank and WTO figures). (26 February 2026) Institute for Integrated Development Studies (IIDS): Study of Nepal’s IT service exports, 2022. Reported via Tech Peak Nepal 2024 (CNI/NAS-IT/AmCham). South Asia Watch on Trade, Economics and Environment (SAWTEE): Unlocking Nepal’s IT services export. Trade, Climate Change and Development Monitor 21(4) (April 2024) Niriv: Is Nepal losing ground in the IT sector to India? GDP share, FY2025/26 budget measures, and the Cotiviti tax case. (17 February 2026) Statista Market Forecast: IT Services — Nepal. (2024) Noble Stack: List of technology companies in Nepal (Fusemachines, Cotiviti, F1Soft). (13 December 2025) Nucamp: Top companies hiring AI engineers in Nepal (2026); Getting a job in tech in Nepal (CloudFactory; compensation). (2025–2026) DataMites: Top IT companies in Nepal (Fusemachines headcount). (2024) Edusanjal; CollegesNepal: BSc CSIT and Institute of Engineering programme data. (2024–2026) MarketsandMarkets: Industrial Control & Factory Automation Market — Global Forecast to 2030. (2026) Mordor Intelligence: Digital Transformation in Manufacturing Market. (2025–2026) Grand View Research: Factory Automation Market Report. (2025) World Economic Forum: Estimates of Industry 4.0 value creation in manufacturing. (reported figure; indicative)

July 6, 2026
Nepal As The Next Big Hub for Data and IT
Abstract. Nepal is increasingly described as an emerging destination for information-technology (IT) and data services, yet the evidence base for this claim is fragmented and its strategic implications are rarely examined systematically. This paper synthesizes publicly available data on Nepal's IT exports, demographics, energy endowment, and digital infrastructure, and positions the country against established and emerging offshoring hubs. We find that headline export figures differ by nearly an order of magnitude depending on measurement methodology; that Nepal's structural advantages a young, low cost, English capable workforce and abundant renewable hydropower are genuine but offset by a thin senior talent layer, infrastructure gaps, an immature data protection regime, and a weak international brand. We argue that Nepal cannot compete on scale and should instead specialize in higher value, judgment intensive segments of the artificial intelligence (AI) data economy. A SWOT analysis, a directional risk assessment, a threephase roadmap to 2035, and scenario projections are presented. The central conclusion is that Nepal's potential is real but conditional on disciplined execution across skills, infrastructure, regulation, and branding. Keywords: Digital economy, IT services offshoring, Artificial intelligence, Data annotation, Demographic dividend, Hydropower, Nepal, Emerging markets 1 Introduction The global market for IT-enabled and AI-related data services has expanded rapidly, and a new generation of lower cost economies is competing to capture a share of work that was once concentrated in a handful of established hubs. Within South Asia, Nepal is frequently cited often in policy rhetoric and investment commentary as a candidate “next” destination for software, business-process, and data-annotation services. The Government of Nepal has reinforced this narrative, declaring a “Decade of Information Technology” and opening the sector to full foreign direct investment [3]. Despite this attention, rigorous analysis of Nepal's actual position is scarce. Reported export values vary widely between sources, the underlying assets are unevenly documented, and discussion tends to oscillate between uncritical optimism and dismissal. This paper addresses that gap. Specifically, it asks: (i) what is the measurable current state of Nepal's IT and data-services economy; (ii) which structural assets and constraints shape its trajectory; (iii) how does Nepal compare with relevant peer economies; and (iv) what strategic posture is most defensible given these conditions. The contribution is threefold. First, we consolidate fragmented public data into a single, source-attributed picture and make explicit the measurement discrepancies that distort the headline narrative. Second, we provide a comparative and strategic assessment SWOT, risk, roadmap, and scenarios grounded in that data. Third, we advance a specific thesis: that Nepal's viable path is specialization in higher-value AI-data work rather than scalebased competition. The remainder of the paper is organized as follows. Section 2 reviews relevant background. Section 3 describes data and methods. Sections 4–5 establish the current state and foundational assets. Sections 6– 7 address comparative positioning and the AI-economy opportunity. Sections 8–9 present the SWOT, risk, roadmap, and scenario analyses. Sections 10–11 discuss implications and conclude. 2 Background and Related Work The offshoring of IT and business-process work is a mature phenomenon dominated by India and the Philippines, whose industries are measured in the tens to hundreds of billions of U.S. dollars and employ millions of workers [7,8]. A second wave encompassing Vietnam, Bangladesh, Sri Lanka, and Pakistan has grown around cost arbitrage and improving digital infrastructure, though comparable national export figures for several of these economies are not consistently published. A distinct and faster-growing segment has emerged around AI: the collection, annotation, and quality assurance of training data, together with model evaluation and human-in-the-loop review. Market analysts estimate the global data-collection-and-labeling market at roughly US$3.8 billion in 2024, growing at approximately 28% annually toward 2030 [5]. This segment is significant for lower-income economies because its entry-level tasks require limited capital and can be performed remotely but it is also the segment most exposed to automation and wage competition. Nepal already hosts a notable proof point: CloudFactory, an internationally active data-operations firm founded in Kathmandu, demonstrates that globally competitive delivery from Nepal is feasible. The present work situates Nepal within this dual landscape of mature offshoring and the emerging AI-data economy. 3 Data and Methodology This study is a synthesis of secondary data drawn from official statistics, multilateral databases, industry associations, and market-research publications. Principal sources include national census and demographic data [4,12,13], central-bank and telecommunications statistics [1,10], energy-sector reporting [2,11], industry and association estimates [6,7,8,9], multilateral trade and balance-of-payments datasets [14,15], and AI-market research [5]. Two methodological cautions apply throughout. First, Nepal's IT export figures are measured inconsistently: balance-of-payments series and industry estimates diverge substantially because a portion of IT earnings is recorded as personal remittances rather than service exports. We therefore present multiple estimates side by side rather than adopting a single figure. Second, for several comparator economies, precise and current national export totals are not reliably available; where this is the case, comparative statements are treated as directional and qualitative, and are explicitly marked. Forward-looking elements the roadmap and scenarios are analytical constructs based on stated assumptions, not forecasts. These limitations are discussed further in Section 10. 4 The Current State of Nepal’s Digital Economy Estimates of the size of Nepal's IT and data-services exports vary by methodology, as shown in Fig. 1. Balanceof-payments figures place ICT service exports at roughly US$118 million in 2022, rising to around US$318 million by 2024 [14]. Industry estimates are considerably higher on the order of US$515 million for 2022 [6] while broader measures of digitally delivered services reach approximately US$836 million for 2023 [15], and association estimates approach US$1 billion for 2026 [9]. The divergence is not merely statistical noise: it reflects the misclassification of IT earnings as remittances and differing scope definitions. Any claim about Nepal's export performance must therefore specify which measure it uses. image.png 60.88 KB Fig. 1. Estimates of Nepal’s IT/data-service exports differ markedly by measurement method. Sources: World Bank [14]; IIDS [6]; WTO [15]; NAS-IT [9]. The strategic relevance of these figures is amplified by the growth of the addressable market. As Fig. 2 illustrates, the global data-collection-and-labeling market is projected to expand from roughly US$3.8 billion in 2024 to approximately US$17 billion by 2030, an annual growth rate near 28% [5]. Even a modest share of this expanding market would be material relative to Nepal's current export base, which underscores why the sector attracts policy attention. image.png 63.74 KB Fig. 2. Projected growth of the global data-collection-and-labeling market, 2024–2030. Source: Grand View Research [5]. 5 Foundational Assets and Constraints 5.1 Talent and Demographics Nepal's principal asset is its population structure. The median age is approximately 25.7 years and close to 47.5% of the population is under 25 [12,13], affording a long demographic runway relative to ageing peer economies (Fig. 3). The labor pool is augmented by a substantial annual output of IT graduates and by broad exposure to English. The constraints are depth and retention rather than quantity: the senior architect and technical-leadership layer is thin, digital literacy is estimated at around 31% against general literacy of roughly 76% [4], and sustained outmigration draws skilled workers abroad. image.png 78.23 KB Fig. 3. Nepal’s median age relative to comparator economies (left) and the share of population under 25 (right). Sources: UN DESA [12]; UNFPA [13]. Energy is Nepal's structural differentiator. More than 90% of generated electricity is renewable, drawn predominantly from hydropower, and the country has become a net exporter to neighboring markets. As Fig. 4 shows, installed capacity (about 3,878 MW in mid-2025) remains a small fraction of the economically viable potential, and national policy targets 28,500 MW by 2035 [2,11]. This endowment underpins a credible case for green, low-carbon data-center capacity although seasonal variability, grid stability, and the country's landlocked geography make this a medium-term opportunity rather than an immediate guarantee. 5.2 Energy Endowment image.png 63.01 KB Fig. 4. Hydropower: large technical headroom against an early build-out, with a 28,500 MW target for 2035. Sources: SASEC [11]; Government of Nepal Energy Roadmap [2]. 5.3 Connectivity and Digital Infrastructure Connectivity is solid but uneven. Internet penetration stands at roughly 56%, covering about 16.6 million users [1], with mobile broadband providing the majority of access [10]. However, household connectivity is markedly higher in the hills than in the mountains (Fig. 5), reflecting a persistent geographic digital divide [4], and no commercial fifth-generation (5G) network is yet in operation. Infrastructure is therefore adequate to support remote service delivery from urban centers today, but uneven enough to constrain a fully distributed national model in the near term. image.png 60.26 KB Fig. 5. Internet penetration (left) and the geographic divide in household connectivity (right). Sources: DataReportal [1]; NTA [10]; Census [4]. 6 Comparative Positioning Benchmarked against established hubs, Nepal's scale disadvantage is decisive. As Fig. 6 shows on a logarithmic axis, India's IT/ITES exports (on the order of US$233 billion) and the Philippines' (around US$40 billion) exceed Nepal's by roughly two orders of magnitude [7,8]. Competing on volume is therefore not a realistic strategy. Table 1 summarizes the comparative picture; precise export values are reported only where verifiable, and qualitative ratings are used elsewhere. image.png 39.01 KB Fig. 6. IT/ITES export scale of selected economies (logarithmic axis). Sources: NASSCOM [8]; IBPAP [7]; NAS-IT [9]. Table 1. Comparative positioning of Nepal against selected economies. “Data n/a” denotes figures not reliably available; ratings are directional. image.png 20.57 KB 7 Strategic Opportunity in the AI Economy If scale is unavailable, the strategic question becomes where within the AI-data value chain Nepal can build a defensible position. Fig. 7 maps candidate service segments along two axes: the value of the work and its resilience to automation, with bubble size indicating ease of entry. Entry-level data annotation is the easiest to enter but the most exposed to both automation and low-cost competition. The more durable opportunities lie in the upper-right region human-in-the-loop review, model evaluation and red-teaming, domain-specific data work (for example, computer-aided-design and engineering data, or regulated healthcare, finance, and legal data), and AI governance support where domain expertise and trust resist commoditization [5]. image.png 139.93 KB Fig. 7. AI-data service segments mapped by value and resilience to automation; bubble size denotes ease of entry. Authors’ synthesis; market context from [5]. This framing implies a deliberate trajectory: use accessible, lower-value tasks as an on-ramp to build capability and client relationships, while investing early in the skills, certifications, and domain knowledge required to migrate into the higher-value, automation-resilient segments before the entry-level base erodes. 8 SWOT and Risk Assessment The preceding analysis is consolidated in the SWOT summary of Fig. 8. A recurring pattern is that each strength is matched by a corresponding vulnerability youthful, low-cost labor against a thin senior layer and out-migration; abundant green power against grid and transmission limitations; an early-mover position against a weak brand and immature regulation. image.png 186.7 KB Fig. 8. SWOT summary for Nepal’s data and IT sector. Table 2 translates the principal threats into a directional risk assessment with candidate mitigations. The two highest-priority risks skilled out-migration and the automation of low-end work are mutually reinforcing: both erode the entry-level base that an early-stage industry depends upon, which strengthens the argument for an early move up the value chain. Table 2. Principal risks (rated directionally) and candidate mitigations. image.png 23.41 KB 9 Strategic Roadmap and Scenarios Fig. 9 sets out a three-phase roadmap to 2035. The foundation phase (2026–2027) prioritizes skills pipelines, anchor clients, a data-protection framework, and a green data-center proof of concept. The scale-up phase (2028– 2031) emphasizes moving up the value chain, establishing Asia-facing delivery hubs, building a mid-tier brand, and improving talent retention. The differentiation phase (2032–2035) targets specialized intellectual property, green-compute exports, a recognized niche brand, and diaspora-led growth. image.png 139.15 KB Fig. 9. Proposed strategic roadmap for Nepal’s data and IT sector, 2026–2035. To make the stakes explicit, Fig. 10 presents three illustrative export trajectories to 2035 under differing execution assumptions. These are analytical scenarios rather than forecasts: the bull case assumes disciplined execution across skills, infrastructure, and regulation; the base case assumes steady but unremarkable progress; and the bear case assumes policy drift and unmitigated brain drain. The width of the resulting fan emphasizes that the outcome depends far more on execution than on Nepal's underlying endowment, which is largely fixed in the medium term. image.png 100.58 KB Fig. 10. Illustrative IT-export trajectories to 2035 under three execution scenarios (analytical assumptions, not forecasts). 10 Discussion The analysis supports a qualified conclusion: Nepal's potential as a data and IT hub is real but conditional. The country possesses a coherent set of advantages demographic, economic, and energy-related that few peer economies combine, and it operates in a market segment whose growth is unusually rapid. Yet none of these advantages is self-executing. The demographic dividend is contingent on retention and skilling; the energy advantage is contingent on grid investment and data-center development; and the early-mover position is contingent on building a brand and a regulatory regime credible enough to win regulated, higher-value work. Three implications follow. First, policy and investment should be selective rather than broad: concentrating on judgment-intensive, domain-specialized AI-data services offers a more defensible position than competing for commodity volume. Second, the binding constraints are institutional talent depth, data-protection law, and branding more than they are physical, which means they are addressable through deliberate policy and firm-level action. Third, because the entry-level base is simultaneously the easiest on-ramp and the most automatable, timing matters: the migration up the value chain should begin early. Several threats to validity should be noted. The export estimates rest on inconsistent measurement, and we have deliberately presented a range rather than a point estimate. Comparative claims for second-wave economies are constrained by data availability and are treated as directional. The roadmap and scenarios are analytical instruments whose parameters are assumptions, not empirical projections, and should be read as illustrative of sensitivity to execution rather than as predictions. Future work should prioritize primary data collection on Nepal's IT workforce and firm-level export performance, and a more formal treatment of the automation exposure of specific task categories. 11 Conclusion This paper has consolidated fragmented public evidence on Nepal's emerging data and IT economy, positioned the country against relevant peers, and proposed a strategic posture grounded in that evidence. The central finding is that Nepal should not pursue scale-based competition, for which it is structurally disadvantaged, but should instead specialise in higher-value, automation-resilient segments of the AI-data economy, leveraging its young workforce, low cost base, and abundant green energy. Whether this potential is realised will depend less on Nepal's endowment—which is favourable—than on disciplined execution across skills development, infrastructure, regulation, and international branding over the coming decade. References 1. DataReportal: Digital 2026: Nepal. Kepios / We Are Social (2026) 2. Government of Nepal, Ministry of Energy, Water Resources and Irrigation: Energy Development Roadmap and Action Plan 2081. Kathmandu (2024) 3. Government of Nepal, Ministry of Finance: Budget Speech FY2024/25: Decade of Information Technology. Kathmandu (2024) 4. Government of Nepal, National Statistics Office: National Population and Housing Census 2021. Kathmandu (2021) 5. Grand View Research: Data Collection and Labeling Market Size, Share & Trends Report, 2024–2030. Grand View Research (2024) 6. Institute for Integrated Development Studies (IIDS): Nepal’s IT Industry: Export Potential and Contribution. IIDS, Kathmandu (2022) 7. IT and Business Process Association of the Philippines (IBPAP): Philippine IT-BPM Industry Performance and Roadmap Update. IBPAP (2025) 8. NASSCOM: Technology Sector in India: Strategic Review. NASSCOM (2025) 9. Nepal Association for Software and IT Companies (NAS-IT): State of Nepal’s IT Sector. NAS-IT (2026) 10. Nepal Telecommunications Authority (NTA): MIS Report on Telecommunications and Internet. NTA (2025) 11. South Asia Subregional Economic Cooperation (SASEC): Installed Electricity Capacity for Nepal Reaches 3,878 MW. SASEC News (2025) 12. United Nations, Department of Economic and Social Affairs, Population Division: World Population Prospects: The 2024 Revision. United Nations (2024) 13. United Nations Population Fund (UNFPA): Nepal: Young People and the Demographic Dividend. UNFPA Nepal (2024) 14. World Bank: ICT Service Exports (BoP, current US$) — Nepal. World Development Indicators (2024) 15. World Trade Organization (WTO): Digitally Delivered Services Trade Dataset — Nepal. WTO (2024)